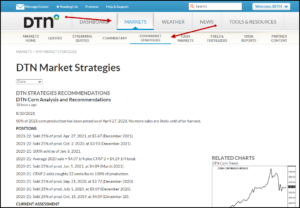
DTN Market Commentary comes with your MyDTN.
Find it under Markets on your dashboard, then select the DTN Market Strategies tab.

The First Factor: The Trend of the Futures Market
Of course, prices seldom move in a straight line. They often go up one day and down the next, in a sort of peaks-and-valleys formation. Trend is the direction of the peaks and valleys.
Directions of trends can always change, but commodity markets tend to follow their own version of the laws of physics: a market in motion trends to stay in motion. For most commodities, the most important trend to watch is the intermediate-term trend. The most important is the short-term trend, because it reflects the seasonal cycles of most crops and the short-term psychology of commodity investors.
The Second Factor: The Positions and Activities of Noncommercial Traders or Large Speculators
In commodity markets, “open interest” is the total number of outstanding contracts held by traders at the end of a trading session. A buyer of a futures contract is said to hold a “long” position, while a seller is said to be “short.” For the market as a whole, the number of long positions must equal the number of short positions—but particular categories of traders may be net-long or net-short.
In this factor, we’re focused on one category: noncommercial traders or speculators. These are traders who are betting on a price movement in a particular direction, rather than hedging or locking in a price to protect a cash-market position. We care about these traders because they’re the ones most likely to move the market by shifting significant sums of money into and out of commodities. Over the course of a week or more, we can see whether they were net buyers, net sellers, or neutral.
The Third Factor: The Trend of Futures Spreads
The futures market positions and activities of large commercial traders—ones like national food processors who hedge cash market positions—offer the best insights into the fundamental supply and demand situation for a commodity. We can infer these traders’ views from “spreads,” or price differences between contracts for different months of the same commodity, because it’s commercial traders’ view of the market that determines the size of these spreads.
When there’s a pattern of spreads with successive months higher than previous months, that indicates there’s “carry” in the market. In these circumstances, the market’s message is: “Big cash buyers don’t want the commodity now; they think there’s enough supply currently, so they are willing to pay you more for it at a later time.”
The amount of carry in the futures spreads can indicate whether commercial traders’ general view of the market is bearish, neutral, or even bullish. Generally, the more carry there is, the more bearish traders are–the less carry, the more bullish they are.
The Fourth Factor: The Seasonal Tendencies of the Market
One relevant indicator of how commodity prices might rise or fall is how they have risen and fallen during the comparable week and month of earlier years.
Seasonal tendencies can have benefits. For one, history can repeat itself, if only irregularly. Also, they reflect the fundamental supply and demand issues that arise over the course of a 12-month
period. For example, during the planting season farmers are busy in the fields and have little time to market stored grain, so buyers who need grain have to raise their bids. However, seasonal tendencies can have drawbacks–especially that certain years or other defined periods of time are never exactly like others they might be compared to for a whole range of reasons.
Because of the pros and cons of seasonal tendencies, it can be helpful to use long-term average seasonal price movement as a primary reference point. Then, seasonals can be helpful in confirming your opinion. For example, if trends are up, noncommercial and commercial traders are both bullish, and the seasonals point up, a lot of stars are aligned for a continued market rise.
The Fifth Factor: The Price Probability
This factor looks at historical price ranges to help us determine the likelihood of price increases or decreases in a particular market. Price probability refers to the percent of the time a commodity has
historically traded over a given price level, usually the current one. A market with a price probability of 10 percent would indicate that the market only trades above the current level 10 percent of the time; the other 90 percent of the time, that market has traded below that level.
A very high price probability, like one in the top five percent of historical price probabilities, would suggest a market that has very little likelihood of rallying further but plenty of room to fall. This kind of market could be suggesting that a producer sell, lock in, or at least protect their current
price. Conversely, a price in the lower 15 percent of its historic price probabilities would suggest that end-users or buyers have ample opportunities to secure needed supplies at historically low prices.
The Sixth Factor: Volatility
Options volatility, a measure of the speed of the market, indicates how much risk there is of big price moves and provides clues to how expensive options premiums are. Generally speaking, the more volatile the market, the higher the potential for a larger profit—but the higher the risk, and the
larger the premium.
Click here to download a .pdf of this information.